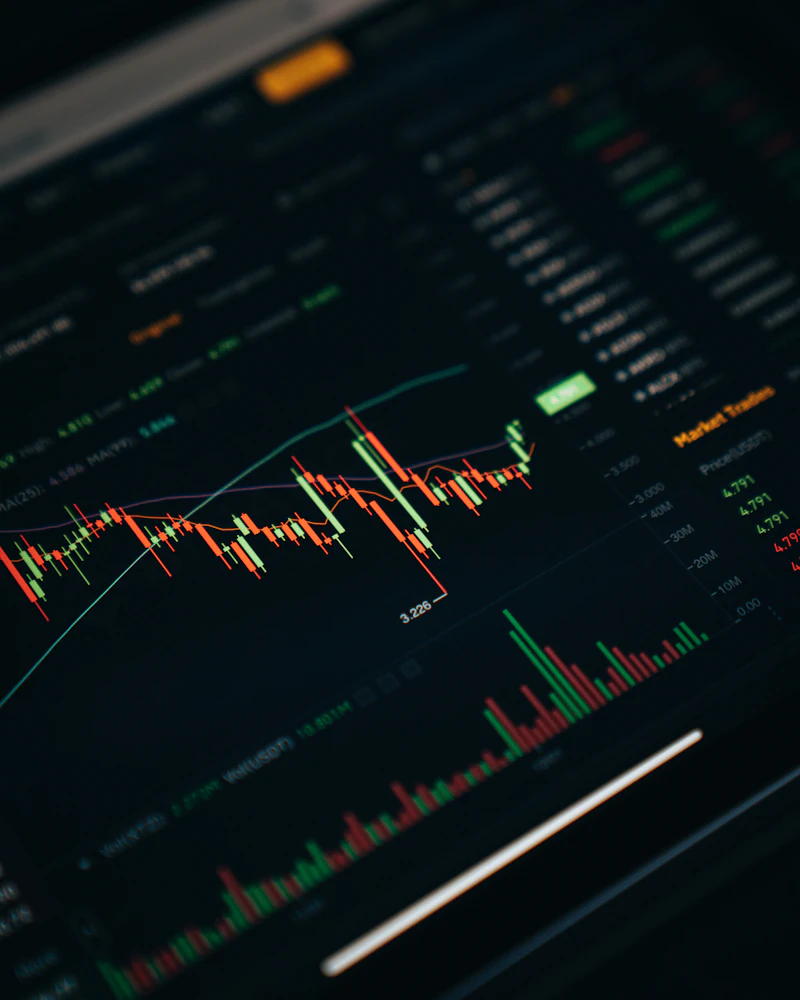
Crypto Technical Analysis for Beginners: Charts, Trends and Indicators Explained

- Primary Signal: Crypto Technical Analysis for Beginners: Charts, Trends and Indicators Explained
- Overview: Technical analysis reads price charts to find trends and turning points instead of guessing. This beginner guide explains candlesticks, support and resistance, and the first indica...
- Verification: Analyzed and compiled by CryptoAce VIP editorial monitoring desk.
Technical analysis reads price charts to find trends and turning points instead of guessing. This beginner guide explains candlesticks, support and resistance, and the first indicators worth learning.
This guide covers what technical analysis is, reading candlestick charts, support, resistance and trends, and first indicators worth learning. Each section explains the topic with concrete examples, so you can use what you learn straight away.
Technical analysis studies past price and volume to judge where a market may go next. It assumes that price reflects everything known about an asset, including news and sentiment. It gives probabilities, not certainties, so a good setup can still lose money.
Each candlestick shows the open, high, low and close for one time period, such as an hour or a day. A long body shows strong buying or selling, while a long wick shows price was rejected at that level. Patterns such as doji and engulfing candles only matter in context, not on their own.
Support is a price level where buyers have stepped in before, and resistance is where sellers have stepped in. A trend is a series of higher highs and higher lows for an uptrend, or lower highs and lower lows for a downtrend. A level that breaks often becomes the opposite: old resistance can turn into new support.
Moving averages smooth price and show the direction of the trend at a glance. The relative strength index flags when an asset has moved unusually far in one direction. Volume confirms a move: a breakout on high volume carries more weight than one on low volume.
More from CryptoAce VIP