Why an $88 billion bank reserve drop doesn’t prove a Bitcoin liquidity squeeze – yet
Story summary
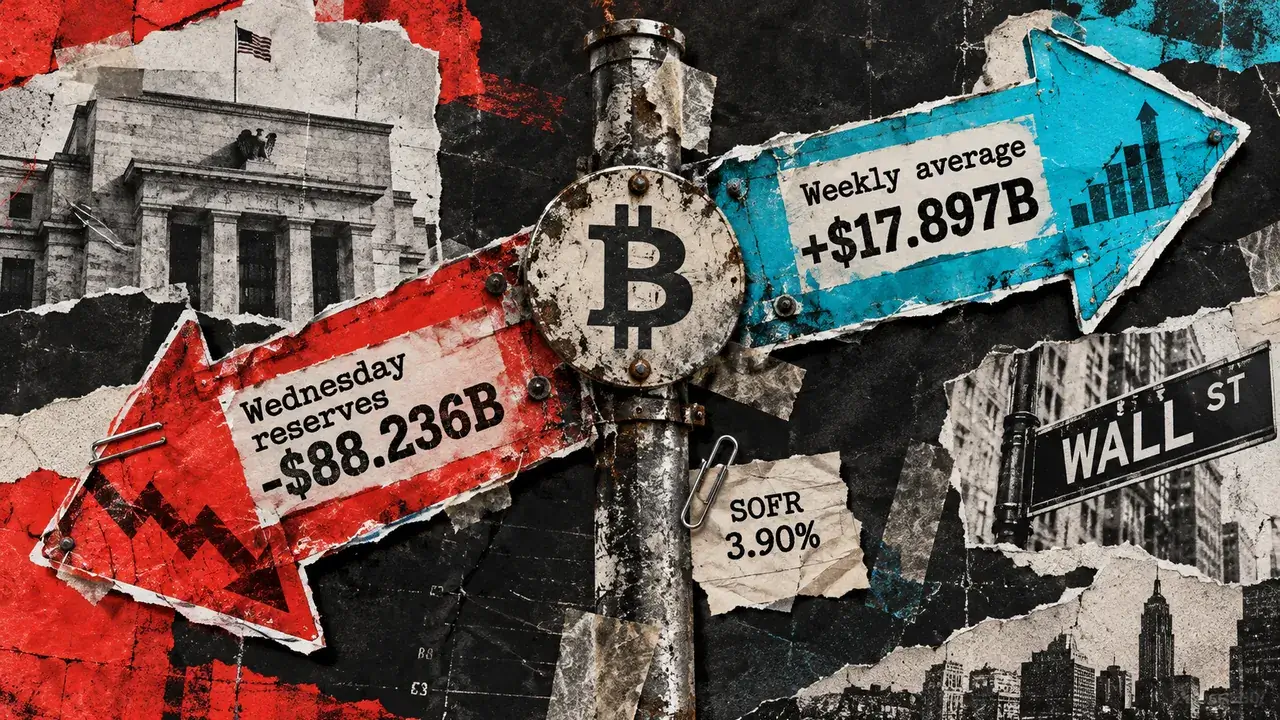
Wednesday reserves fell $88.236 billion while their weekly average rose $17.897 billion, exposing the limits of reserve-based Bitcoin liquidity signals. The post Why an $88 billion bank reserve drop doesn’t prove a Bitcoin liquidity squeeze – yet appeared first on CryptoSlate.
📌 Key Highlights & Takeaways
- Wednesday reserves fell $88.236 billion while their weekly average rose $17.897 billion, exposing the limits of reserve-based Bitcoin liquidity signals.
- The post Why an $88 billion bank reserve drop doesn’t prove a Bitcoin liquidity squeeze – yet appeared first on CryptoSlate.
Bitcoin’s quarter-end liquidity signal changes direction depending on which reserve measure is used. Federal Reserve data released Oct. 1 show bank reserves falling $88.236 billion between Sept. 23 and Sept. 30 Wednesday snapshots, while their weekly average rose $17.897 billion.
Reserves are balances banks hold at the Federal Reserve to make and receive payments. Their level matters for dollar financing, but a reserve chart alone cannot establish whether pressure reached Bitcoin. The balance-sheet decline is largely accounted for by Treasury cash and reverse repos, predominantly involving foreign official accounts. September 30’s median cost of Treasury-backed overnight borrowing was 3.90%, within the range of the five latest observed readings.
September’s quarter-end therefore offers a test of the measurements behind a liquidity thesis. An endpoint balance, an average balance and a funding price describe different aspects of the system. Treating them as interchangeable can turn the same week into opposing market signals.
The Wednesday reserve series fell from $2.969922 trillion on Sept. 23 to $2.881686 trillion on Sept. 30. The weekly-average series rose from $2.930193 trillion to $2.948090 trillion for the weeks ending on those dates.
Both readings come from the Fed’s H.4.1 release. One compares balances on two Wednesdays; the other compares averages of daily figures across two weeks. A lower final observation can coexist with a higher average, because the readings cover different time windows.
The Treasury General Account, the government’s account at the Fed, illustrates the same problem. Its Wednesday balance rose $36.729 billion to $984.046 billion. Its weekly average fell $28.410 billion to $948.674 billion.
Mixing the Wednesday reserve decline with the average Treasury decline would combine observations from different windows. It could obscure the very cash movement an investor is trying to explain. A chart labeled “weekly” still needs a second question: is each point a weekly average or a balance observed once a week?
The endpoint captures the quarter-end position. The average describes the level across the week. Neither provides a complete daily path or proves how persistent the final-day position will be. For a Bitcoin liquidity argument, choosing the window changes the evidence before any price forecast enters the discussion.
Crypto Profit & Yield Calculator
Simulate trading returns, staking APY, and crypto gains with real-time fee modeling.
Source: CryptoSlate.
Read the full story at the original source ↗
For questions: mrsmithcons@gmail.com.
💎 On-Chain Wallet Tracking & Breakout Targets
Direct wallet address monitoring, smart money flows, and liquidity depth.
⚡ Track Whale Wallets Now ➔More from CryptoAce VIP


 ₿ Lucky Satoshi
Darius Dale: Will Global Liquidity Send Bitcoin Higher in 2027?
Bitcoin Magazine Darius Dale: Will Global Liquidity Send Bitcoin Higher in 2027? Darius Dale warns near-term l...
 🪙 FreeFortune Crypto
Live updates: Bitcoin manages small gains as stocks drop on AI concern, oil surges
The Federal Reserve's two-day policy meeting begins tomorrow, with nearly all now expecting the U.S. central b...
 🚀 RocketCoin Casino
Crypto Casinos 2026 - Bitcoin, Ethereum & Altcoin Casino Guide
Breaking coverage reported by 25yearslatersite.com: Crypto Casinos 2026 - Bitcoin, Ethereum & Altcoin Casino G...
 ⚡ LiveCoin Bet
Zcash Co-Founder Backs Shielded Bitcoin, Says His ZEC Year-End Target Is Still in Play
Zcash co-founder Eli Ben-Sasson backs Shielded Bitcoin for private L1 transfers and sticks with a $5,000 ZEC t...