Por que a onda HODL de 63% do Bitcoin não é o mega sinal de alta que todos pensam que é
Story summary
A percentagem de um ano aumentou 0,98 pontos percentuais num mês, enquanto as faixas etárias adjacentes se deslocaram em torno do limiar. O post Por que a onda HODL de 63% do Bitcoin não é o mega sinal de alta que todos pensam que apareceu pela primeira vez no CryptoSlate.
📌 Key Highlights & Takeaways
- A percentagem de um ano aumentou 0,98 pontos percentuais num mês, enquanto as faixas etárias adjacentes se deslocaram em torno do limiar.
- O post Por que a onda HODL de 63% do Bitcoin não é o mega sinal de alta que todos pensam que apareceu pela primeira vez no CryptoSlate.
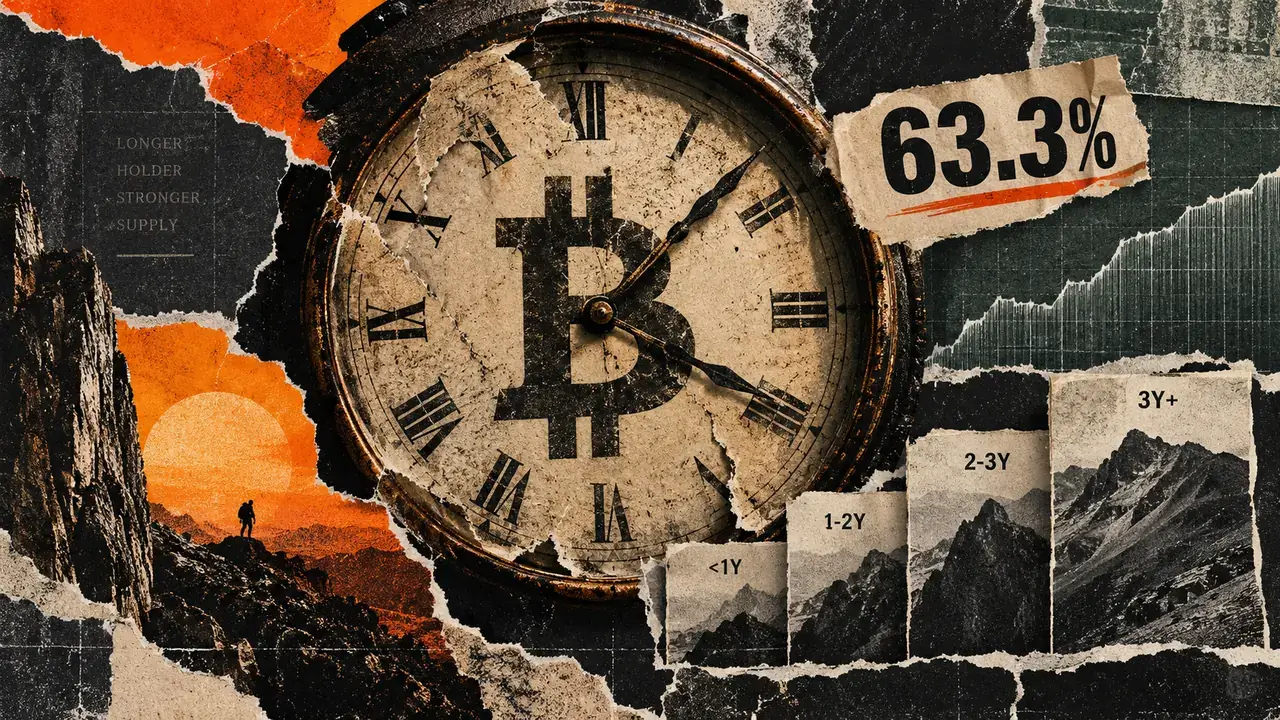
Bitcoin ’s share of supply last moved at least one year ago reached 63.3% on Sept. 18, up 0.98 percentage points from 62.32% on Aug. 18, according to Maketo’s HODL-wave data.
HODL waves group Bitcoin’s unspent transaction outputs into age bands based on their last on-chain movement. The rising one-year share therefore shows that more supply now sits in older bands. Current-month buying and deliberate withdrawal from the market require separate evidence.
The underlying bands point to a specific mechanism. Coins that last moved roughly a year ago can enter the one-to-two-year bracket simply by remaining still long enough to cross the boundary.
The one-to-two-year band increased to 14.57% of supply from 13.52% between Aug. 18 and Sept. 18, a gain of 1.05 percentage points. That was the largest positive change among the cohorts already older than one year.
Over the same period, the six-to-twelve-month band fell to 17.53% from 19.10%. Glassnode’s Sept. 18 snapshot showed the same latest values for both bands.
The paired moves are consistent with coins crossing the one-year boundary. Each band is a net share after coins age into it, age out of it or move on-chain and reset to the youngest cohort, leaving the identity and gross flow of the underlying units unresolved.
Recent movement also eased. Coins last moved within one month accounted for 7.03% of supply on Sept. 18, down 0.27 percentage points from 7.30% a month earlier.
Under Glassnode’s methodology , an unmoved output advances into older bands as it crosses each age threshold. Movement resets the clock.
Crypto Profit & Yield Calculator
Simulate trading returns, staking APY, and crypto gains with real-time fee modeling.
Source: CryptoSlate.
On-Chain Whale Radar: Smart Money Cold Wallet Outflows & High-Yield DeFi Opportunities
Uncover high-yield crypto alpha, on-chain whale accumulation alerts, 100x altcoin gems, and automated DeFi yield opportunities before the retail crowd.
Track Whale Wallets ➔💎 On-Chain Wallet Tracking & Breakout Targets
Direct wallet address monitoring, smart money flows, and liquidity depth.
⚡ Track Whale Wallets Now ➔More from CryptoAce VIP
 📈 1UpTrade Live
Bitcoin Forecast: What's Next for BTC After the Fed Decision?
Breaking coverage reported by FOREX.com: Bitcoin Forecast: What's Next for BTC After the Fed Decision?. Our ne...
🚀 RocketCoin Casino
Melhor Bitcoin Casino Canadá 2026 – Top 5 testados para CAD
Cobertura de última hora relatada pela BetaNews: Best Bitcoin Casino Canada 2026 – Top 5 testados para CAD. No...
 ₿ Lucky Satoshi
European Central Bank President Blocked Binance’s EU Entry: Report
Bitcoin Magazine European Central Bank President Blocked Binance’s EU Entry: Report A Wall Street Journal repo...
 ⚡ LiveCoin Bet
A Better Trade Than Bitcoin or Gold in 2026 Is Sitting in Your Kitchen
Raw sugar futures have gained roughly 20% in 2026, outpacing Bitcoin (BTC), gold, and the S&P 500 as the Europ...