How to Read a Crypto Chart: Candlesticks, Volume and Support Explained for Beginners
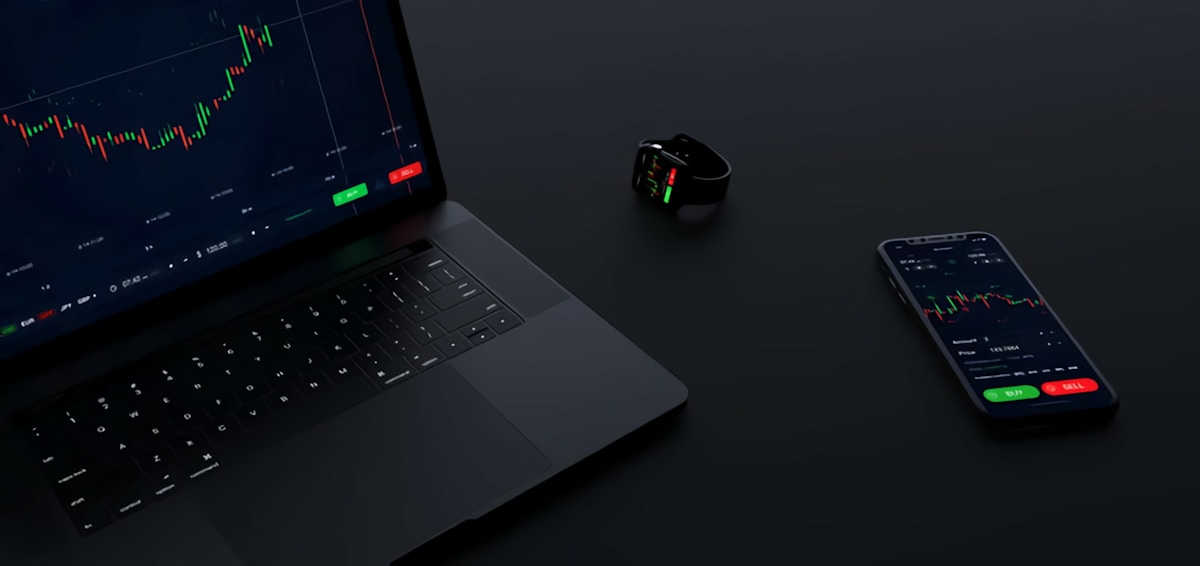
- Primary Signal: How to Read a Crypto Chart: Candlesticks, Volume and Support Explained for Beginners
- Overview: Candlesticks, volume, and support and resistance are the three building blocks of reading crypto charts, and this beginner's guide explains each one plainly....
- Verification: Analyzed and compiled by CryptoAce VIP editorial monitoring desk.
Crypto charts look intimidating at first: jagged lines, coloured bars, and numbers moving too fast to follow. But a chart is just a picture of what buyers and sellers have been doing, and learning to read the basics takes less time than most beginners expect. This guide covers candlesticks, volume, and support and resistance, the three building blocks that make every other chart concept easier.
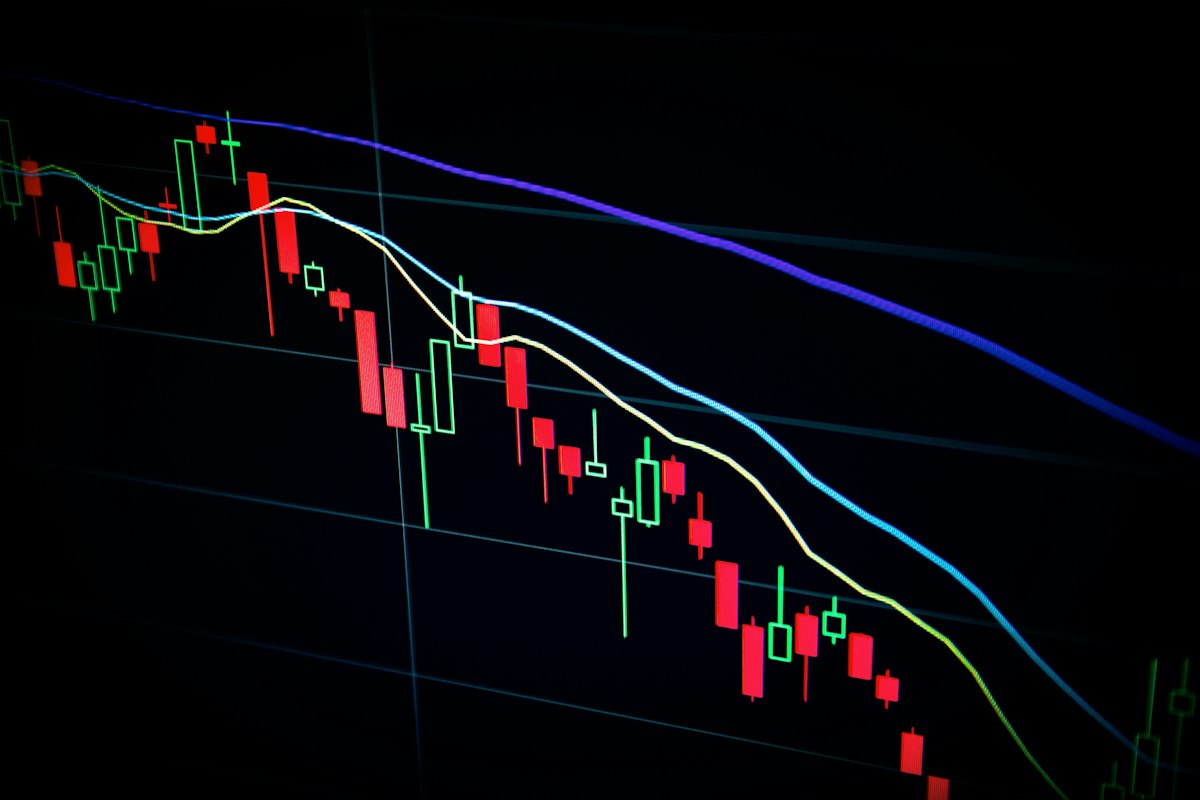
Each candlestick shows the price action for one time period, such as an hour or a day. The body shows where the price opened and closed, while the thin lines above and below, called wicks, show the highest and lowest prices reached. A green or white candle usually means the price closed higher than it opened, while a red or black candle means it closed lower. Long bodies mean strong movement in one direction; long wicks mean price was pushed far but returned, which often signals rejection of that level.
Volume shows how much of an asset changed hands during each period, usually as bars beneath the price chart. High volume on a price rise suggests strong buying interest and a more trustworthy move, while a rise on low volume is weaker and more likely to reverse. Watch for volume spikes at key moments, such as breakouts or sharp falls, because they show where large numbers of traders acted. Volume does not predict direction on its own, but it tells you how much weight to give a move.
Support is a price level where buying has repeatedly stopped falls, and resistance is a level where selling has repeatedly stopped rises. These levels form because traders remember past prices and act around them, placing buy orders near previous lows and sell orders near previous highs. When price breaks through a level with strong volume, that level often flips its role: old resistance becomes new support, and vice versa. Drawing these levels on your chart turns a confusing chart into a map of where traders are likely to act.
Start with a simple routine: open the daily chart, identify the recent trend, mark the obvious support and resistance levels, and check whether volume supports the current move. Avoid adding dozens of indicators at first; a clean chart with candles, volume, and two or three levels teaches more than a chart covered in lines. Read charts to understand what has happened and where traders are positioned, not to predict the future with certainty. The goal is better decisions, not perfect forecasts, and that is a skill that improves with every chart you study.
Chart reading improves with regular, short practice rather than occasional long sessions. Spend ten minutes a day studying one chart: mark its trend, its support and resistance levels, and whether volume supports the current move. Write down one observation, even if it is simple, and review your notes weekly to see whether your observations were useful. Over months, this habit builds pattern recognition that no single tutorial can provide. Avoid the temptation to trade on every observation; for your first months, practise reading without trading, or trade only tiny amounts, so that learning stays cheap and your confidence grows from evidence rather than luck.
Beginners make a few predictable chart mistakes that are easy to avoid once you know them. Overloading a chart with indicators is the most common: ten lines on a chart hide the price action they were meant to clarify, so start with price and volume alone. Mixing timeframes is another trap, because a trend on the hourly chart may be noise on the daily chart, and decisions should match the timeframe you trade. Recency bias makes the last few candles feel more important than months of history, so always zoom out before judging a move. And drawing support and resistance levels to fit a hoped-for outcome, rather than where price actually turned, creates false confidence. A clean chart and honest levels will teach you far more than a crowded one.
📖 Continue Reading the Full Story
Continue reading this article on CryptoAce VIP.
⚡ Access Full Content NowMore from CryptoAce VIP


 🚀 RocketCoin Casino
Can an AI Receptionist Handle Player Support for a Crypto Casino?
Crypto casinos run all night — and so do player support issues. Here's how an AI voice receptionist answers ev...
 🪙 FreeFortune Crypto
Can an AI Receptionist Handle Support for a Web3 Startup?
Web3 users span every timezone — your support can't keep banker's hours. Here's how an AI voice receptionist a...
⚡ LiveCoin Bet
Can AI Voice Agents Handle a Crypto Trading Desk's Phone Lines?
A trading desk's phone goes from quiet to twenty simultaneous calls during a liquidation cascade. AI voice age...
 🤖 1UpTrade Quant
How Do Grid Trading Bots Work in Crypto Markets?
Grid trading bots place a ladder of buy and sell orders at fixed price intervals, automatically buying dips an...