How to Read Crypto Candlestick Charts for Beginners
- Primary Signal: How to Read Crypto Candlestick Charts for Beginners
- Overview: A candlestick is four prices drawn as a shape: open, high, low, close. This beginner's guide explains bodies, wicks, the patterns you'll actually meet, and why context matters more...
- Verification: Analyzed and compiled by CryptoAce VIP editorial monitoring desk.
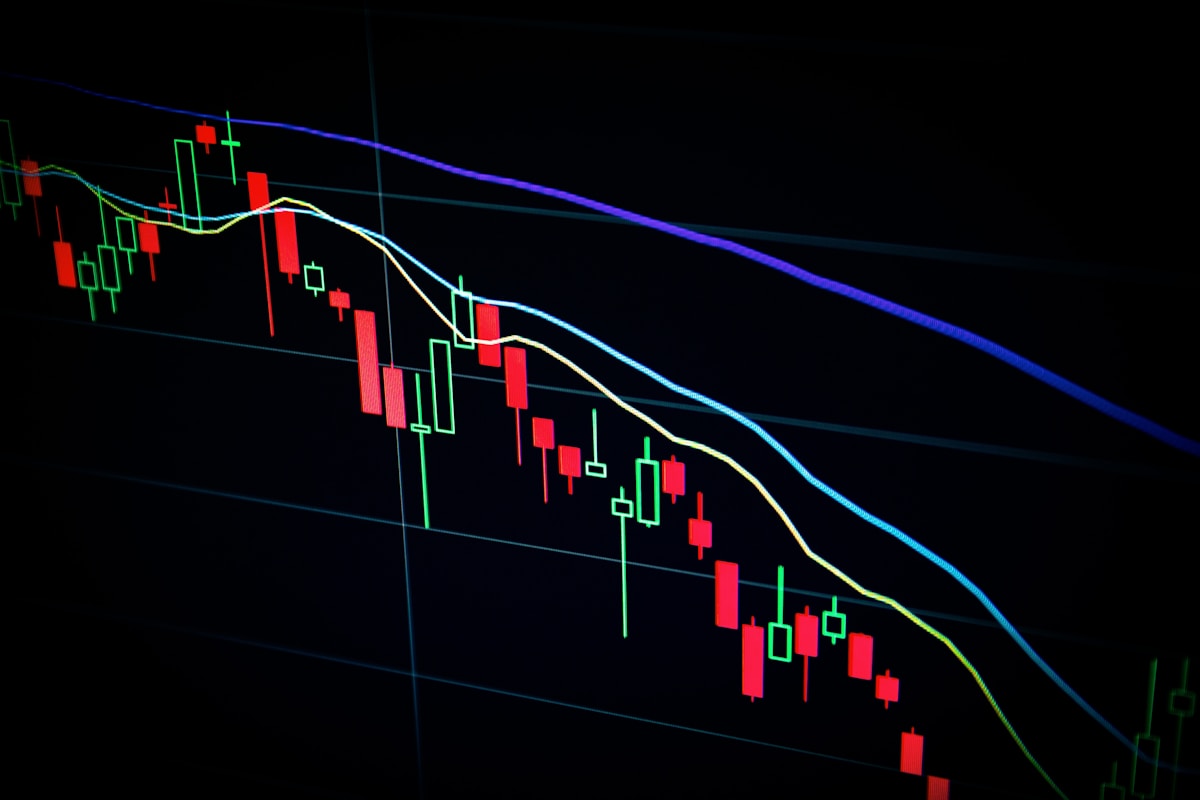
A candlestick chart is a visual record of where buyers and sellers agreed to trade over time, and each candle compresses one period — a minute, an hour, a day — into a single shape. Every candle records four prices: the open, the first traded price in the period; the high, the highest price reached; the low, the lowest price reached; and the close, the last traded price. The thick body spans the open to the close, and the thin wicks above and below mark the high and the low.
Color is the surface, not the substance. A green candle means the close was above the open, so buyers won the period. A red candle means the close was below the open, so sellers won it. But color alone misleads: a tall green candle with a long upper wick tells a different story from a tall green candle with short wicks, because the first shows sellers pushing back hard near the top. Read the whole shape, not just the color.
The body shows how decisively one side won the period. A long body with short wicks means one side dominated from start to finish with little argument. A small body with long wicks on both sides means price travelled a long way in both directions and ended near where it started — a sign of indecision, and often a warning that a move is running out of steam.
Wicks are rejection signals. A long lower wick means sellers pushed price down and buyers pushed it all the way back, rejecting lower prices. A long upper wick means the reverse: buyers pushed up and sellers forced price back down. In both cases the wick marks a level the market visited and refused to hold, which is useful information when that same level is tested again later.
A few patterns show up constantly and are worth learning by name. A doji is a candle with a tiny body and long wicks, signalling that neither side could take control. A hammer has a small body at the top and a long lower wick, and when it appears after a decline it can suggest buyers are stepping in — though it means little on its own. A bullish engulfing pattern is a green candle whose body fully covers the previous red candle's body, suggesting a shift in control, while a shooting star, a small body at the bottom with a long upper wick after a rise, can suggest selling pressure arriving.
The honest caveat is that candlestick patterns are probabilistic, not predictive. Even well-known patterns fail a large share of the time when read in isolation, and their usefulness rises sharply when they appear at a meaningful price level, in line with the higher-timeframe trend, and with volume behind them. A hammer in the middle of nowhere is noise. A hammer at a support level that has held three times before, with rising volume, is a clue worth noting.
One candle covers whatever timeframe you select, and timeframe choice changes everything. A daily candle compresses a whole day into one shape, while a five-minute candle captures a few minutes of noise. For beginners, the daily chart gives trend context, the four-hour chart is a good place to confirm setups, and shorter timeframes are best left alone until you can read the longer ones fluently, because lower timeframes carry far more random movement.
A simple workflow ties it together. Open a major pair on the daily chart and ask whether it is making higher highs or lower highs. Mark the obvious support and resistance levels, the prices where the market has repeatedly turned. Then look for candles and patterns near those levels, and check whether volume supports what the candles suggest. If trend, level, and volume all point the same way, you have a structured read. If they disagree, you have a reason to wait, which is itself a valuable answer.
Most beginners repeat the same errors. The first is reading a single candle as a signal: one candle is one period of one market, and patterns matter in context, not in isolation. The second is ignoring volume, which is the confirmation that real participation stands behind a move. The third is forcing patterns that are not clearly there, seeing hammers and engulfing bars in every cluster of candles.
Finally, remember that chart reading is a skill for understanding markets, not a guarantee of profit. Candlestick patterns describe what buyers and sellers did, not what they will do next, and no pattern removes risk. This article is educational only and is not financial advice. Practice on historical charts, keep a journal of your reads and what actually happened, and let repetition — not excitement — build your skill.
📖 Continue Reading the Full Story
Continue reading this article on CryptoAce VIP.
⚡ Access Full Content NowMore from CryptoAce VIP

 🪙 FreeFortune Crypto
Why Is Solana Faster Than Ethereum? A Simple Explanation for Beginners
Solana confirms transactions in under a second while Ethereum's base layer takes much longer. The difference c...
🚀 RocketCoin Casino
Can an AI Receptionist Handle Player Support for a Crypto Casino?
Crypto casinos run all night — and so do player support issues. Here's how an AI voice receptionist answers ev...
⚡ LiveCoin Bet
Can AI Voice Agents Handle a Crypto Trading Desk's Phone Lines?
A trading desk's phone goes from quiet to twenty simultaneous calls during a liquidation cascade. AI voice age...
 🤖 1UpTrade Quant
How Do Grid Trading Bots Work in Crypto Markets?
Grid trading bots place a ladder of buy and sell orders at fixed price intervals, automatically buying dips an...